Northeast
Most drafty and poorly insulated homes (17.2% and 20.6%); fewest original windows. Prioritize attic sealing, rim joists and basements; cold-climate heat pumps compete with oil. Strong state rebate programs.
Loading...
Home Energy Scope · Locations
Climate sets the priorities of a retrofit and regional housing stock sets the starting conditions. The EIA's 2024 survey shows the Northeast with the most homes described as drafty and poorly insulated, the South with the most attics and single-pane windows, and the Midwest with the most original windows. This page summarizes those differences and matches you with professionals in your area.
The EIA's 2024 Residential Energy Consumption Survey is the only public source that reports housing conditions by census region with a stated denominator, and the regional spread is wider for energy than for most home services. Draftiness, insulation quality, window age and attic presence all vary meaningfully between the Northeast and the South, and those differences change what an assessor looks for first.
The figures here are kept exactly as the survey states them, occupied primary residences by census region, with no extrapolation to a state or city. Use them to anticipate what a local pro will find, then request estimates through the contact page; matching is by service area.
Most drafty and poorly insulated homes (17.2% and 20.6%); fewest original windows. Prioritize attic sealing, rim joists and basements; cold-climate heat pumps compete with oil. Strong state rebate programs.
Most attics (55.3%) and most original and single-pane windows (71.5% and 37.4%). Duct leakage testing, attic ventilation and low solar heat gain glass lead. Solar production is strong; export rules vary.
Both heating and cooling loads; basements common; 54.2% original windows. Rim joist and basement wall insulation are accessible; check moisture first. Ground-source heat pumps more common.
Fewest attics (38.0%); cooling and shading climate; wildfire smoke makes filtered ventilation valuable. Highest electricity rates and sun give solar its best case; batteries increasingly included.
Nationally, our analysis of the EIA's 2024 survey found 13.8% of homes drafty most or all of the time and 17.6% described as poorly insulated. The Northeast leads both at 17.2% and 20.6%, reflecting the oldest housing stock and the harshest heating season. The South reports the least draftiness at 11.3% but the most homes with mostly original windows at 71.5% and mostly single-pane glass at 37.4%.
Attics, the usual first retrofit target, are present in 47.6% of homes nationally, from 38.0% in the West to 55.3% in the South. LED adoption is uniform: at least half of indoor bulbs are LED in 74.8% of homes nationally and 73.3% to 76.5% by region, while fully LED homes run from 36.1% in the Northeast to 37.8% in the West, 36.7% nationally. Lighting is rarely the regional lever.
| Region | Drafty most/all of the time | Described as poorly insulated | Mostly original windows | Mostly single-pane | Has an attic |
|---|---|---|---|---|---|
| Northeast | 17.2% | 20.6% | 47.6% | 30.1% | 40.6% |
| Midwest | 15.8% | 17.8% | 54.2% | 28.8% | 49.5% |
| South | 11.3% | 15.6% | 71.5% | 37.4% | 55.3% |
| West | 13.4% | 18.5% | 66.0% | 31.9% | 38.0% |
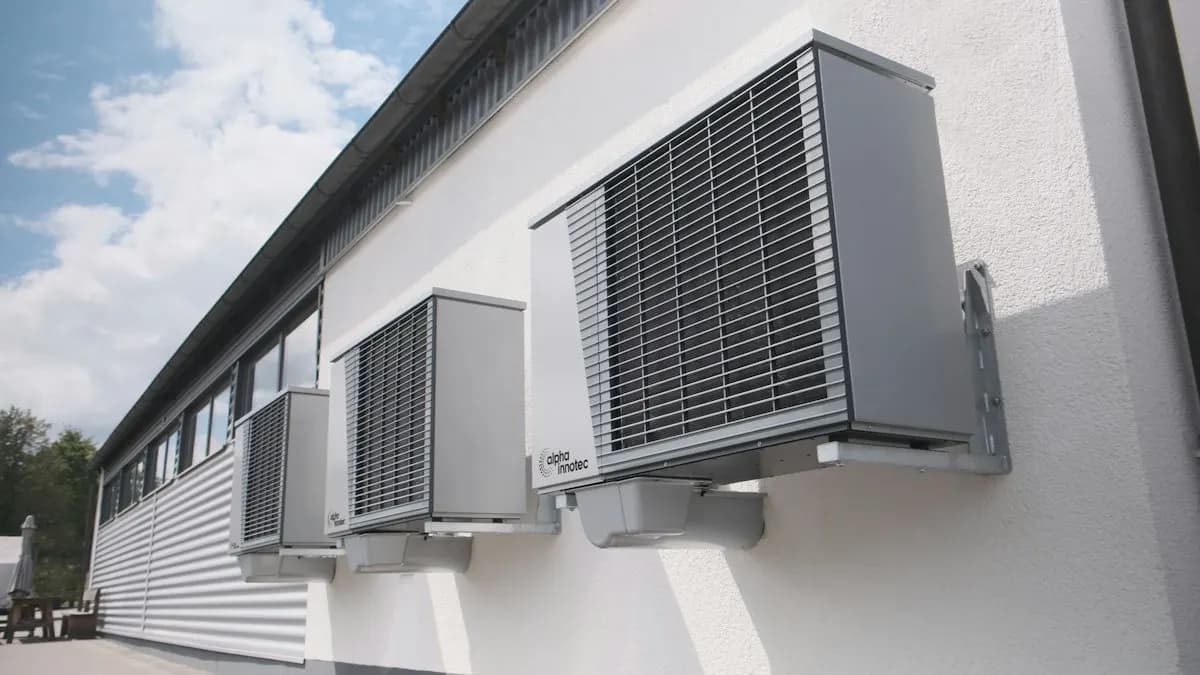
Long heating seasons, old housing and a high share of oil and gas heat make air sealing and attic insulation the first move in most Northeast homes, followed by rim joists and basement walls. Ice dams are a symptom of attic air leakage, not a roofing problem. Windows have been replaced more here than anywhere, which is why the region has the fewest original windows, but triple-pane makes sense where single-pane remains. Heat pumps rated for cold climates now compete with oil, and several states run strong rebate programs.
The South's retrofit story is the attic: most homes have one, ducts often run through it, and summer attic temperatures push duct leakage and heat gain into the house. Duct sealing, attic ventilation, radiant barriers and attic insulation lead, and a duct leakage test is the diagnostic that matters most. Original and single-pane windows are common, so low solar heat gain glass has a real case on west exposures. The South also leads on outdoor incandescent or halogen bulbs left burning all night, 10.1% of homes against 8.6% nationally by our count.
Cold winters and humid summers mean the Midwest needs both heating and cooling measures, and basements are common, which makes rim joist sealing and basement wall insulation accessible. The region reports the second-highest draftiness, with 45.4% of homes drafty some of the time against 41.3% nationally, and a high share of original windows at 54.2%. Ground-source heat pumps are more common here than elsewhere. Attic sealing and insulation remain the first job, and moisture management in basements is the check that precedes insulating them.
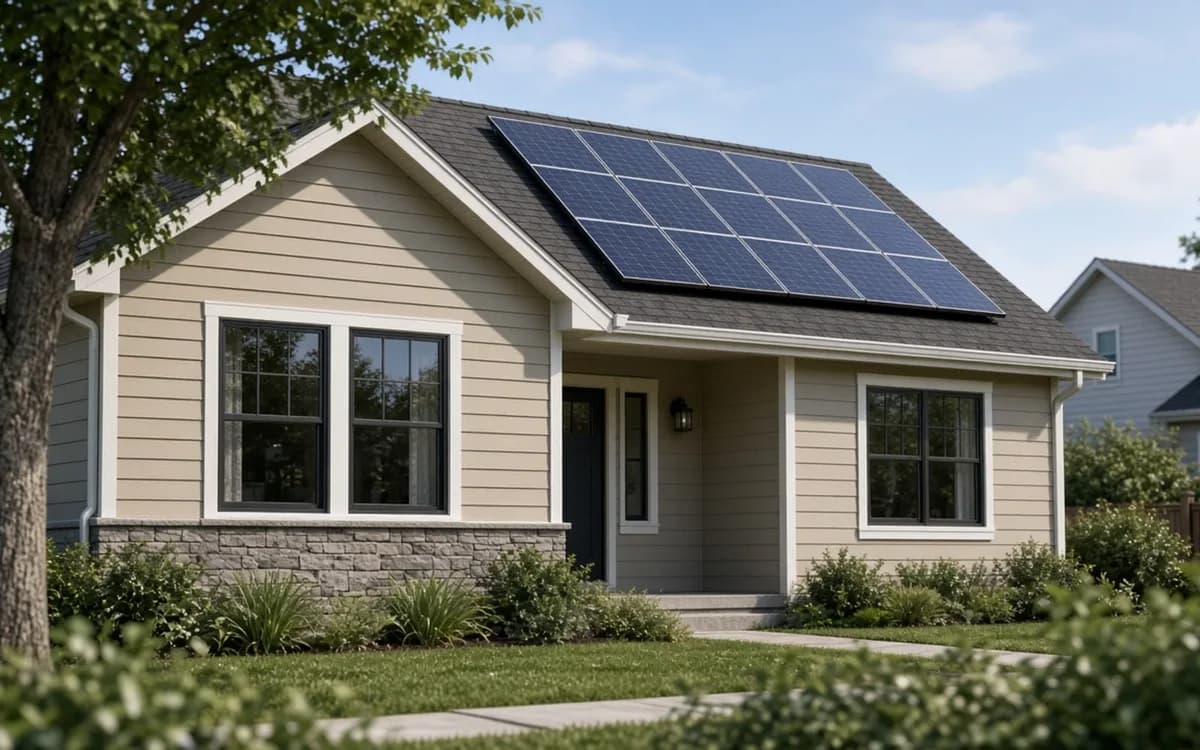
Much of the West is a cooling and shading climate, with attics less common at 38.0% of homes and slab construction frequent; it also has the highest share described as uninsulated, 3.5% against 2.6% nationally. Window film, exterior shading and low solar heat gain glass matter on west exposures. Wildfire smoke seasons make tight envelopes and filtered mechanical ventilation a health measure as well as an energy one. High electricity rates in several states and abundant sun give solar its strongest economics, but export rules have tightened in some markets and batteries are increasingly part of the proposal.
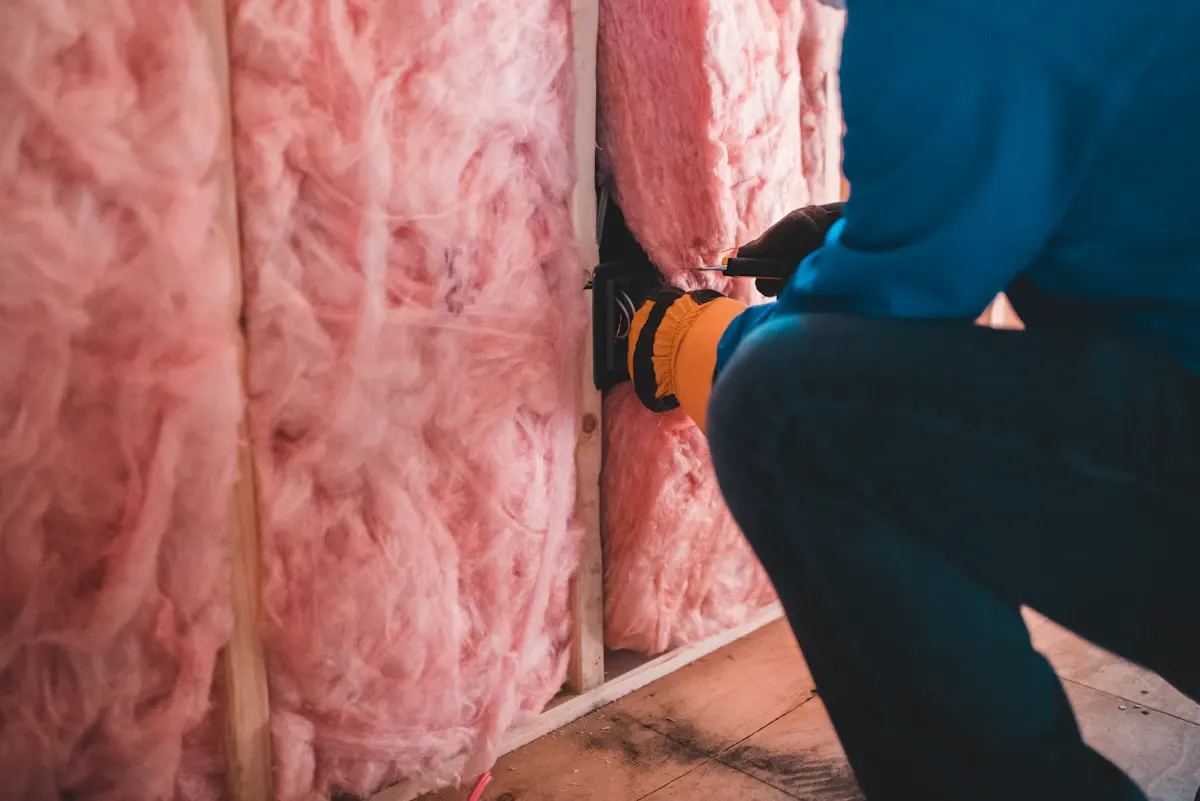
Requests go to independent auditors, insulation contractors, window installers and solar companies serving your area and scope. Matching does not rank them; it introduces you, and the written estimate does the rest. Because incentives are now mostly state and utility programs, the local questions to ask are which rebates the pro is enrolled in, whether pre-approval is required before work, and whether the utility offers a subsidized assessment. The reviews page explains how to verify credentials yourself.
Homes drafty most or all of the time: 13.8% nationally. Highest in Massachusetts (20.8%), Kansas (19.8%), Oklahoma (19.2%); lowest in Florida (5.5%), Hawaii (6.6%), North Dakota (7.8%).
Homes described as poorly insulated or uninsulated: 20.2% nationally. Highest in Hawaii (47.3%), Oklahoma (26.3%), Massachusetts (26.1%); lowest in South Dakota (8.5%), Utah (11.8%), Alaska (12.4%).
Homes with mostly single-pane windows: 33.1% nationally. Highest in Hawaii (63%), Florida (45.7%), Mississippi (43.9%); lowest in Alaska (15.9%), Washington (19.3%), Vermont (20%).
Homes with mostly original windows: 62.4% nationally. Highest in Mississippi (81.6%), Arizona (79.1%), Hawaii (78.3%); lowest in Massachusetts (44.7%), New York (46.1%), Ohio (47.4%).
Home Energy Scope calculated these state estimates from the Energy Information Administration's 2024 household survey microdata. EIA publishes the 2024 survey nationally and by region, not by state. Shares are weighted; a dash means the state sample was too small for a reliable estimate (fewer than 100 households, fewer than 10 yes answers, or a relative standard error above 30%). Source data.
| State | Homes drafty most or all of the time | Homes described as poorly insulated or uninsulated | Homes with mostly single-pane windows | Homes with mostly original windows |
|---|---|---|---|---|
| United States | 13.8% | 20.2% | 33.1% | 62.4% |
| Alabama | 10.5% | 21.7% | 42.6% | 76.9% |
| Alaska | 10.3% | 12.4% | 15.9% | 73.7% |
| Arizona | 11.6% | 20.6% | 34.1% | 79.1% |
| Arkansas | 14.3% | 23% | 35.6% | 71.5% |
| California | 15.7% | 25.8% | 38.4% | 62.7% |
| Colorado | 10.1% | 13.8% | 21.5% | 67.7% |
| Connecticut | 16.7% | 22.1% | 28.6% | 48.5% |
| Delaware | — | 14.3% | 22% | 62% |
| District of Columbia | 15.3% | 25.4% | 35.3% | 57.4% |
| Florida | 5.5% | 15.4% | 45.7% | 72.7% |
| Georgia | 12.8% | 19.7% | 35% | 77.5% |
| Hawaii | 6.6% | 47.3% | 63% | 78.3% |
| Idaho | 10.7% | 16.2% | 24.1% | 71.8% |
| Illinois | 15.5% | 21.7% | 29.1% | 54% |
| Indiana | 15.6% | 23.1% | 28.3% | 55.3% |
| Iowa | 16.3% | 17.1% | 24.3% | 58.7% |
| Kansas | 19.8% | 19% | 38% | 59.9% |
| Kentucky | 11.8% | 18.9% | 29.5% | 60.6% |
| Louisiana | 9.5% | 18.3% | 41% | 71.5% |
| Maine | 12.1% | 13% | 20.2% | 51.5% |
| Maryland | 12.4% | 15.8% | 23.6% | 56.3% |
| Massachusetts | 20.8% | 26.1% | 27.1% | 44.7% |
| Michigan | 16.9% | 21.5% | 31% | 54% |
| Minnesota | 11.4% | 14% | 25.3% | 56.9% |
| Mississippi | 16% | 18.9% | 43.9% | 81.6% |
| Missouri | 17.3% | 19.5% | 32.9% | 58.1% |
| Montana | 11.5% | 20% | 24.2% | 62.4% |
| Nebraska | 13.8% | 16.2% | 31% | 54.8% |
| Nevada | 12% | 17.9% | 28.9% | 74.3% |
| New Hampshire | 16.5% | 22.7% | 24.9% | 47.8% |
| New Jersey | 18.3% | 23.3% | 34% | 51.8% |
| New Mexico | 10.4% | 20% | 32.1% | 69.9% |
| New York | 17.6% | 23.1% | 32.7% | 46.1% |
| North Carolina | 15.3% | 17.4% | 35% | 71.9% |
| North Dakota | 7.8% | 13.5% | 21% | 69.2% |
| Ohio | 16.7% | 19.9% | 28% | 47.4% |
| Oklahoma | 19.2% | 26.3% | 38.4% | 64.9% |
| Oregon | 13% | 19.6% | 23.4% | 60.4% |
| Pennsylvania | 15.7% | 25.2% | 28% | 47.9% |
| Rhode Island | 15.2% | 23.8% | 29.1% | 47.9% |
| South Carolina | 10.4% | 18% | 30.8% | 73.4% |
| South Dakota | — | 8.5% | 21.2% | 66.7% |
| Tennessee | 12.1% | 14.9% | 34.7% | 67% |
| Texas | 11% | 17.4% | 41.1% | 77.2% |
| Utah | 10.1% | 11.8% | 21.6% | 66.6% |
| Vermont | 8.5% | 15.3% | 20% | 49% |
| Virginia | 12.7% | 16% | 27% | 62.6% |
| Washington | 12.9% | 19.6% | 19.3% | 62.3% |
| West Virginia | 16.9% | 22.4% | 28.1% | 56.1% |
| Wisconsin | 17% | 23% | 25.1% | 51.1% |
| Wyoming | 11.4% | 20.9% | 23.8% | 60.9% |
Homeowner polls
No votes yet. Yours will be the first. · saved on this device
The federal 25C and 25D credits ended for property placed in service after Dec 31, 2025.
No votes yet. Yours will be the first. · saved on this device
Older housing, colder winters that make drafts noticeable, and heating systems that create larger indoor-outdoor pressure differences. The EIA figures are household descriptions, so part of the gap is perception: a draft in January in Vermont is felt; the same leak in Georgia is not. Either way, air sealing returns more per dollar where heating seasons are long.
Not from this source. The EIA reports census regions with stated standard errors, and the survey was not designed for state or city estimates, so this site does not extrapolate. Your utility and state energy office often publish local program data, and a local auditor will know the typical failures in your housing stock.
Substantially, now that the federal credits have ended. State HEAR and HOMES programs launched on different schedules with different income rules; several Northeast and West states have long-running utility efficiency programs; some Southern utilities offer little beyond an assessment. Check DOE's Home Energy Rebates page for your state's status and your utility's program list before assuming any incentive.
It changes how much and where. Cold climates want higher attic R-values, sealed rim joists and attention to vapor control; hot-humid climates want attic ventilation preserved, ducts sealed and sometimes a radiant barrier; dry climates focus on cooling and shading. Material choice follows the location in the house more than the region, with blown-in for open attics and foam for rim joists in every climate.
Often, because payback follows electricity rates and export rules more than sunshine. Northeast states with high rates and net metering can beat Southern states with low rates and poor export credit. EnergySage's 25-year savings range of $41,000 to $155,000 reflects exactly that spread. Run the numbers for your utility, not your latitude.
Energy codes set minimum insulation and window performance for permitted work, and some jurisdictions require blower door testing or mechanical ventilation when a home is tightened. Solar requires electrical and structural permits everywhere and utility interconnection approval. Historic districts may restrict window styles. Ask each pro which local rules apply and who handles compliance.
Submit a request through the contact page with your location and scope; matching is by service area. Then verify each respondent: BPI or RESNET credentials for auditors, contractor licensing and insurance for installers, and enrollment in the rebate programs you plan to use. The reviews page lists the checks.
 Service guideHome Energy Audits
A home energy audit connects comfort complaints and utility bills to the measured condition of the house through a blower door test, thermal imaging, duct leakage testing and combustion-safety checks, then delivers written, prioritized recommendations.
 Service guideInsulation & Air Sealing
Air sealing closes the gaps that move air through the attic plane, rim joist and penetrations; insulation slows heat conduction through the assemblies around them.
 Service guideWindow & Door Replacement
Window and door replacement addresses openings with a defined problem: damage, failed seals, poor operation, drafts, single-pane glass in a cold climate, or a door that leaks and does not latch.
 Service guideSolar Panel Installation
Solar panel installation covers the roof and shading assessment, equipment selection, electrical and structural permits, utility interconnection and the production and financial assumptions in the proposal.
Tell us the size, the condition of what is there now, and what you want to change. Home Energy Scope passes your request to independent local professionals, who reply with written, no-obligation estimates. The service is free to use.